Financial Time Series Analysis
 Financial Time Series Analysis in R
Description
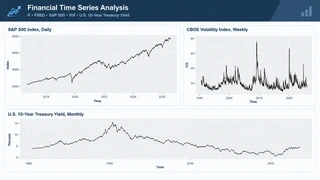
This project focuses on the analysis of financial time series with different temporal frequencies using R and data from the Federal Reserve Bank of St. Louis FRED database.
Three financial indicators were analyzed:
- S&P 500 at daily frequency
- CBOE Volatility Index (VIX) at weekly frequency
- U.S. 10-Year Treasury Yield at monthly frequency
The analysis explores the temporal behaviour, transformations, volatility, persistence, and statistical characteristics of each series.
Technical Approach
S&P 500 returns: Daily continuously compounded returns were calculated using logarithmic price changes.
VIX transformation: Daily observations were converted to weekly frequency and week-to-week changes were calculated.
Treasury Yield transformation: Daily observations were aggregated to monthly frequency and monthly changes were computed.
Multi-frequency analysis: Each series was analysed at a frequency appropriate to its characteristics and intended forecasting horizon.
Analysis & Visualization
The project includes exploratory analysis and visualizations to identify:
- Long-term trends
- Volatility and large market movements
- Persistence and temporal dependence
- Structural changes across different market regimes
The analysis highlights notable periods such as the 2008–2009 financial crisis, the 2020 market shock, and subsequent changes in equity prices, volatility, and interest rates.
Descriptive Statistics
Descriptive statistics were calculated for the original time series, including:
- Mean
- Standard deviation
- Minimum and maximum values
- Quartiles
These statistics were used to compare the scale and historical variability of the three financial variables.
Forecasting Perspective
The project also evaluates potential applications of forecasting models for different financial decision-making scenarios.
The proposed forecasting horizons vary according to the temporal frequency and behaviour of each series:
- S&P 500: 1–5 trading days for short-term portfolio monitoring and risk management.
- VIX: Several weeks for volatility and hedging analysis.
- 10-Year Treasury Yield: Several months for interest-rate exposure and asset-allocation decisions.
Tools & Technologies
- R
- FRED API / FRED Database
- Time Series Analysis
- Statistical Analysis
- Data Visualization
- LaTeX
Outcome
The project provides a comparative analysis of three financial time series with substantially different dynamics and frequencies, demonstrating how transformations, temporal aggregation, visualization, and descriptive statistics can be used to prepare financial data for further forecasting analysis.
The complete analysis is reproducible through the accompanying R script, which handles data retrieval, cleaning, transformation, visualization, and statistical summaries.

Mathematics and Computer Engineering student with a focus on the intersection of rigorous theory and high-performance implementation. With a background marked by 23+ “Matrículas de Honor” and multiple Regional Olympiad awards, I thrive on bridging the gap between abstract mathematical models and efficient computational systems.
My core interests lie in Quantitative Finance, Stochastic Calculus, and Numerical Optimization. I am particularly passionate about transforming complex financial frameworks into high-performance algorithmic solutions. Currently, I balance my research in Quant Finance and Deep Learning with active leadership in university commissions.